



SaaS Sprawl Stabilizing? 3 Shocking Spend Truths

 Jul 15,2026
  By Muhammad Danish
 SaaS sprawl was supposed to be the crisis of 2023. Everyone talked about it — the audits, the “app rationalization” initiatives, the dashboards built just to count dashboards. And it worked, sort of. The number of new tools entering the average company has leveled off. By most standard measures, SaaS sprawl is stabilizing.
So why are SaaS budgets still climbing?
At Cloud Fold Studio, we’ve sat in enough vendor reviews to see the pattern clearly: SaaS sprawl stabilizing doesn’t mean SaaS spend is under control. It means the growth moved somewhere harder to see. Fewer new logos, higher per-seat costs, AI feature tiers stacked on top of existing contracts, and usage-based pricing that quietly outpaces headcount. The sprawl problem got a haircut. The spend problem didn’t.
What “Stabilizing” Actually Means
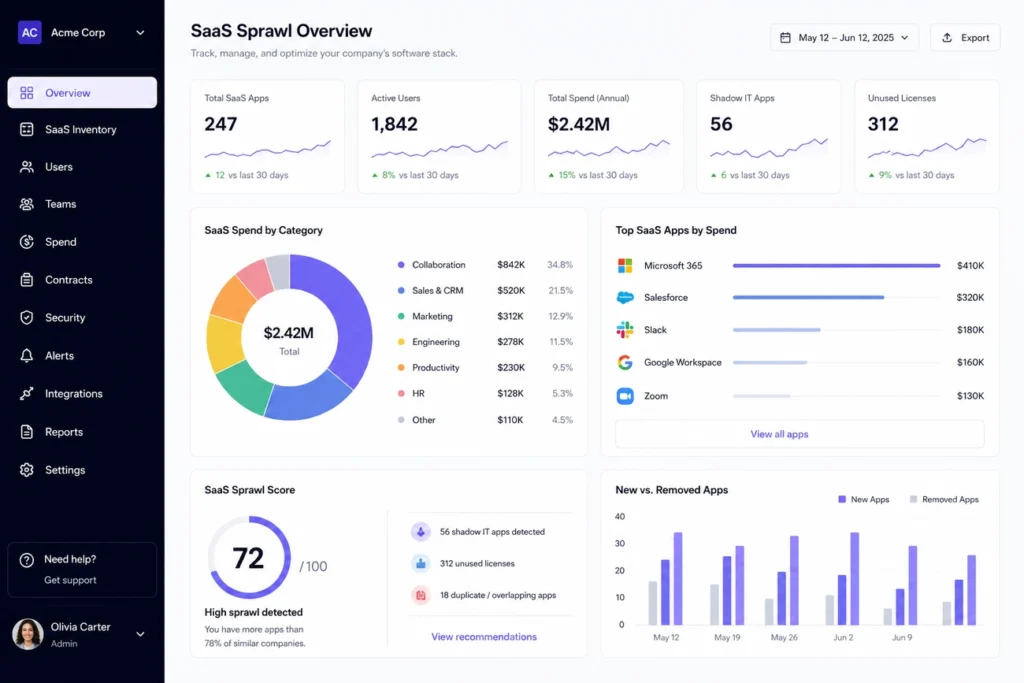
When people say SaaS sprawl is stabilizing, they usually mean one specific thing: the raw count of applications per company has stopped climbing at the pace it did during 2021 and 2022. IT and procurement teams spent the last two years building shadow-IT inventories, consolidating overlapping tools, and enforcing purchase approval workflows. That work paid off in one narrow sense — fewer duplicate project management tools, fewer redundant analytics platforms, fewer forgotten trial subscriptions still auto-renewing.
But tool count was never the real cost driver on its own. It was a proxy for something else: how much of the business ran on software nobody was actively managing. You can freeze the number of apps at three hundred and still watch the bill triple, because the cost per app didn’t freeze along with it.
This is the gap most cost reviews miss. They measure sprawl the way it was measured in 2022, and then report success when the count flattens, without checking whether the underlying spend curve flattened too. Frequently, it hasn’t.
Where the Spend Is Actually Coming From
Three forces are doing most of the work here, and none of them show up in a simple app-count audit.
Per-seat price increases. Established vendors have raised list prices steadily, often bundling in new functionality — much of it AI-related — whether or not a given team uses it. A tool that cost a fixed amount per seat two years ago frequently costs more per seat today, for the same seats doing the same work.
Usage-based and consumption pricing. A growing share of SaaS contracts, especially anything touching AI features, bills on usage rather than seats: API calls, tokens processed, storage consumed, records synced. Usage-based pricing scales with activity, not with a negotiated cap, so a busy quarter can quietly produce a spend spike with no new purchase order behind it. Our own breakdown of how AI token costs accumulate covers this pattern in more detail.
Tier creep. Vendors increasingly push existing customers toward premium tiers to unlock AI copilots, advanced analytics, or higher rate limits. Nobody signs a new contract for tier creep. It shows up as a renewal quote that’s larger than last year’s, for a plan that looks nearly identical on paper.
Put together, these three forces explain why finance teams can report a flat or shrinking software portfolio and a rising software budget in the same quarter. The apps stabilized. The economics inside each app didn’t.
Why AI Features Are Accelerating This
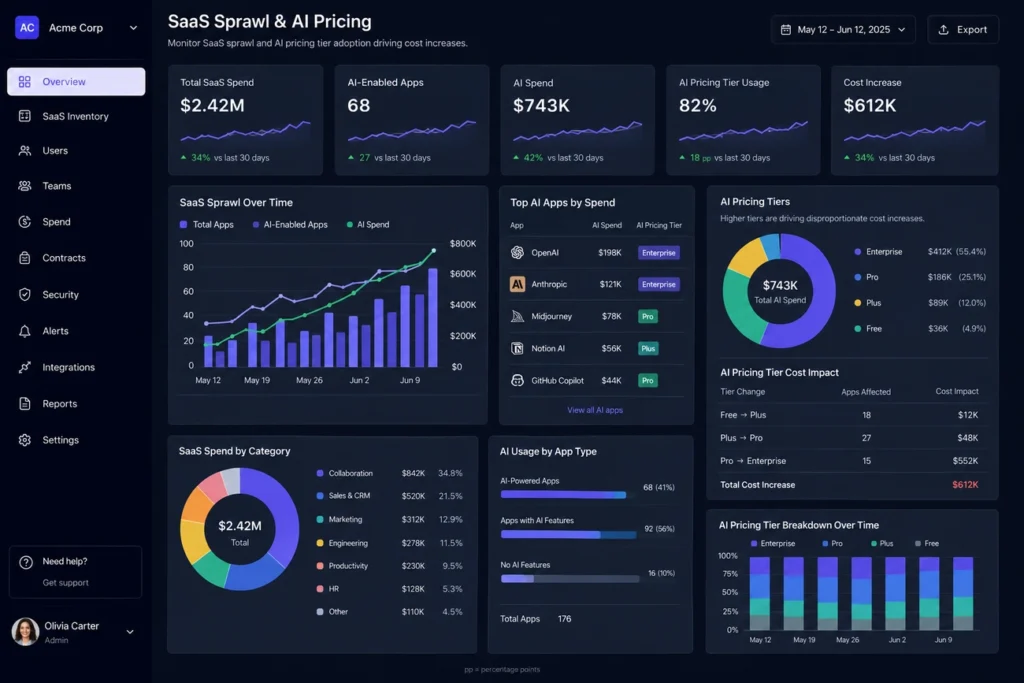
AI is the biggest single driver behind the divergence between sprawl and spend right now. Vendors are attaching AI functionality to existing products at a pace that outstrips how carefully most companies are evaluating whether they need it, and pricing models are shifting to match — from flat per-seat AI add-ons to consumption pricing tied directly to model usage.
That creates two problems at once for buyers.
First, the pricing is genuinely harder to forecast. A per-seat license is predictable: multiply seats by price, done. A token-based AI feature is not — usage depends on how employees actually use the tool day to day, which nobody can fully predict in a budget cycle set months in advance.
Second, AI features are easy to approve and hard to walk back. A single manager greenlighting an “AI copilot” upgrade for their team rarely goes through the same procurement scrutiny as a brand-new vendor relationship would, even though the cost impact can be just as significant. This is exactly the kind of governance gap we cover in our AI governance framework — the tools sprawl less, but the decisions authorizing new spend sprawl more. Industry benchmarking from Gartner’s SaaS spending research shows a similar divergence between vendor counts and total contract value across enterprise buyers.
The Consolidation Trap
There’s an ironic twist here worth naming directly: consolidation efforts, done without a cost lens, can actually raise spend even while lowering tool count.
When companies merge three overlapping tools into one “best of breed” platform, that platform is frequently priced at a premium tier to support the broader feature set, higher usage volume, and expanded seat count it now needs to cover. The line-item count goes down. The invoice does not.
This isn’t an argument against consolidation — fragmented tooling carries its own well-documented costs in lost productivity and data silos. It’s an argument for tracking the right metric. App count is easy to measure and satisfying to report on. Total cost per active user, segmented by seat-based versus usage-based spend, is the number that actually predicts next quarter’s bill.
Treat SaaS sprawl and SaaS spend as two separate metrics that happen to share a name. A company can genuinely solve sprawl — fewer duplicate tools, cleaner vendor lists, tighter procurement approval — while the cost side keeps climbing untouched underneath. Reporting on sprawl alone gives leadership a false read on whether the underlying spend problem is actually improving.
What to Track Instead of Tool Count
If sprawl stabilizing gave your organization a false sense of control, a few adjustments tend to close that gap quickly:
Separate seat-based and usage-based spend in every report. They behave differently and need different forecasting approaches. Blending them into a single “SaaS spend” line hides which portion is actually volatile.
Audit tier upgrades, not just new purchases. Procurement workflows are usually built to catch new vendor relationships. They’re rarely built to flag an existing vendor’s renewal moving from Standard to Premium. That’s where a lot of quiet spend growth is currently hiding.
Set usage alerts on consumption-based contracts. If a tool bills by API calls or tokens, treat it like a utility bill with a threshold alert, not a fixed subscription you check once a year. For teams managing several of these simultaneously, our data quality checklist includes a section on monitoring usage-based vendor costs alongside data integrity checks.
Review AI add-ons on their own renewal cycle. Don’t let an AI feature upgrade ride along silently inside a broader platform renewal. Evaluate it as its own line item with its own ROI case.
Ask what “active” actually means before counting seats as necessary. A seat that logged in once last quarter is technically active and functionally wasted. Usage-based license audits catch this in a way that simple app inventories don’t.
The Real Signal Behind Stabilizing Sprawl
SaaS sprawl stabilizing is a genuine win, and the procurement discipline that produced it deserves credit. But it solved the visible half of the problem. The count of tools was always easier to control than the cost structure inside each tool, and vendors have adapted their pricing models faster than most cost-control processes have adapted their tracking.
The businesses staying ahead of this aren’t the ones with the fewest tools. They’re the ones who stopped treating “fewer apps” as a proxy for “lower cost” and started measuring the two separately. A stabilized SaaS sprawl number looks good in a board deck, but it was never the finish line. It was the point where the real cost conversation was supposed to start — and for most teams, that conversation is still overdue.
Not sure whether your SaaS spend curve matches your sprawl curve? At Cloud Fold Studio, we help SaaS and platform teams separate seat-based, usage-based, and AI-driven costs so budgets stop drifting quietly upward. Reach out for a free spend breakdown of your current stack.


 Aug 18, 2026